
Hello World!

Welcome to my first blog post! It has been a hot second since I last wrote a blog post (Xanga anyone?) but I am back and ready to share with you some thoughts I have gathered over this past week.
Now you as the reader, who somehow managed to find your way to my blog post, may be wondering, “what is this blogger going to talk about for his first blog post in two decades?” (And if not, then joke’s on me, but joke’s on you because I don’t care! Hah!…please don’t leave…) For starters, I’d like to share why this blog post, let alone this website, exists today.
Here We Go…
Two weeks ago, I ended my nearly half-century career as a management consultant. It was an amazing opportunity for me - working for so many different clients within so many different industries, along with all the incredibly talented people I got to collaborate with. I had a glimpse of what data management looked like (e.g. data governance, master data management) and it was because of that exposure did my curiosity grow for how to go about gaining insights from the data itself.
So like most journeys, there always is an end, and that was the case for this particular chapter of my life.
So What’s Next?
One week ago, I started attending classes at Metis - an organization that provides full-time, in-person data science education for twelve weeks at a time. The bootcamp is available at multiple locations - I went with the San Francisco offering.
I chose to fully devote myself to the three month data science program because I wanted to develop new skills and be able to use them repeatedly. In other words - learning through repetition. Also, the general recommendation for anyone developing new skills is to come up with a topic you’re interested in and to work on a project utilizing your newfound capabilities. Through Metis’ data science bootcamp, each student has the opportunity to work on a total of five projects - four which are structured around the topics covered in the classes, and the fifth where each student has the opportunity to choose the subject matter - typically one he or she is passionate about.
Then there’s the aspect of being a part of a class. Everyone is there to learn the same topic - in this case, data science. We learn together, we struggle together, and we prosper together. Then there are the professors who are there rooting for us. I dig such a collaborative learning environment.
Metis also does a great job with helping students get to know one another via daily pair programming sessions. Every morning, students are paired up with someone new to solve problems that are typically seen in data science interviews. A couple of the questions I saw this past week definitely played games with my heart, but a twitter post shared by the professors taught me that learning can be challenging, and at times you will struggle, but the adversities you face and overcome is how you know you’re doing it right.
Project Benson - aka MTA Data Analysis
I am (was?) an East Coaster. I was born in New York and moved to New Jersey soon after. Eventually I went back to New York for my undergraduate degree and for work, aka ‘adulting.’ It wasn’t until recently did I decide to move to the west coast (BEST COAST!… am I doing it right?)
So when my professors dropped the news earlier this week that my class’ first project would revolve around New York City MTA data, there was definitely a sense of nostalgia happening. The many fond memories I have of the public transportation system offered in the city that never sleeps, like the lack of air conditioning in practically every subway station; the rats that roamed and ruled the train tracks; the delays, oh the delays…
Although my recollection of the NYC subway stations isn’t captured in the freely available MTA subway data, what is captured played a huge role in helping me and my group complete our first project.
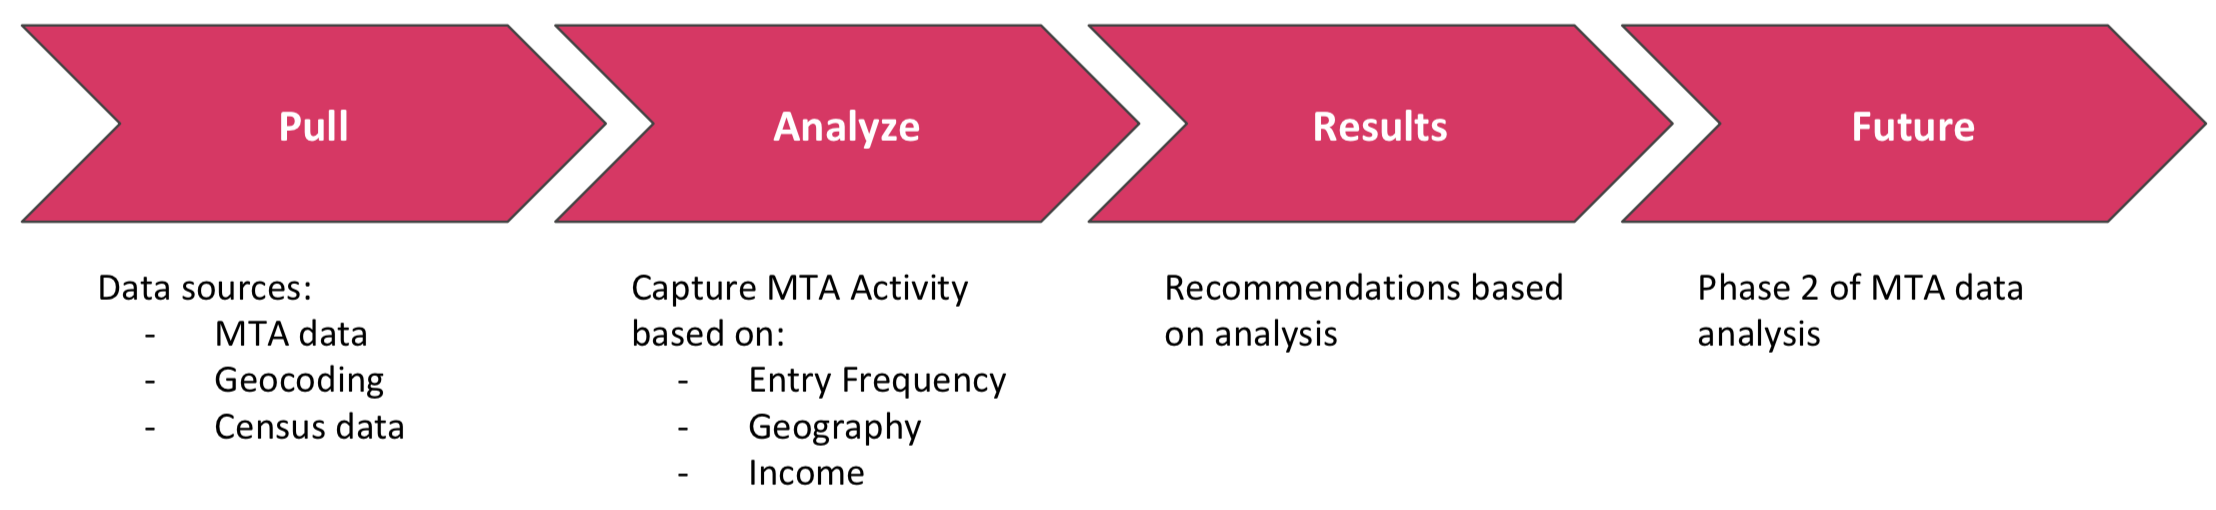
Our task was to utilize MTA data, and other data sources of our choosing, in order to assist the client define which train stations to deploy street teams for both promoting an upcoming gala event and inviting participants who are passionate about increasing diversity in the technology industry. At a high level, my group came up with a general four-step approach for solving this problem:
-
Pull: Gather all the data sources that we believed were both relevant and beneficial for our research purposes. In this case, we knew we wanted MTA data to get a sense of what activity at each train station was like. Also, given the second requirement of wanting to find gala participants who would contribute to the client’s cause, we wanted to pull NYC income and household data offered by the U.S. Census Bureau. In order to tie MTA data with census data, zip code data was required - we turned to Google Maps Platform for that.
- Clean: Data is messy. There are many characteristics that can skew the insights gathered from exploratory data analysis, like:
- Duplicate data
- Unstandardized data values
- Incorrect / flawed data types
MTA data is no exception to the messy data syndrome - got to clean before accurate insights can be seen.
-
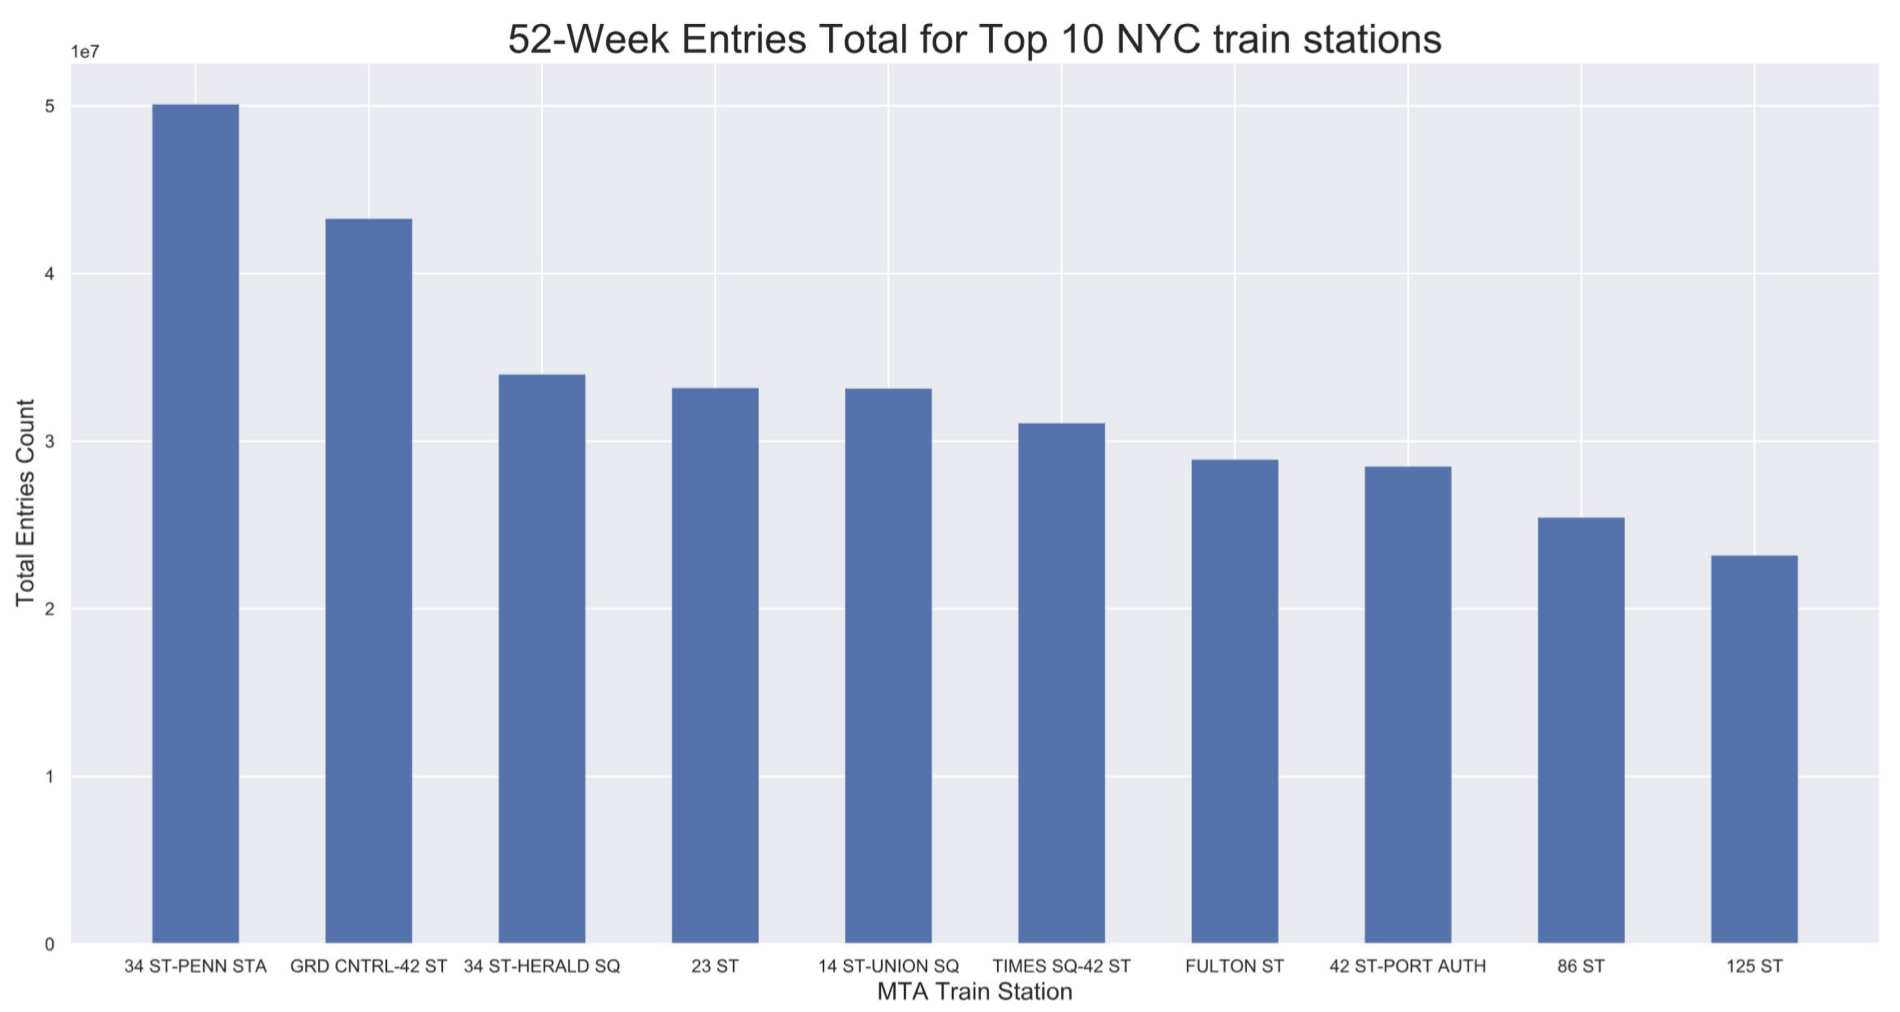
Analyze: This is where the insights and recommendations stem from. For my group specifically, we knew we wanted to find train stations with the highest total number of entries over the last 52-weeks. We also wanted to consider city areas with large number of households that had incomes ranging between $100k to $200k. Our assumption was that such households would be more inclined to contribute to the annual gala.
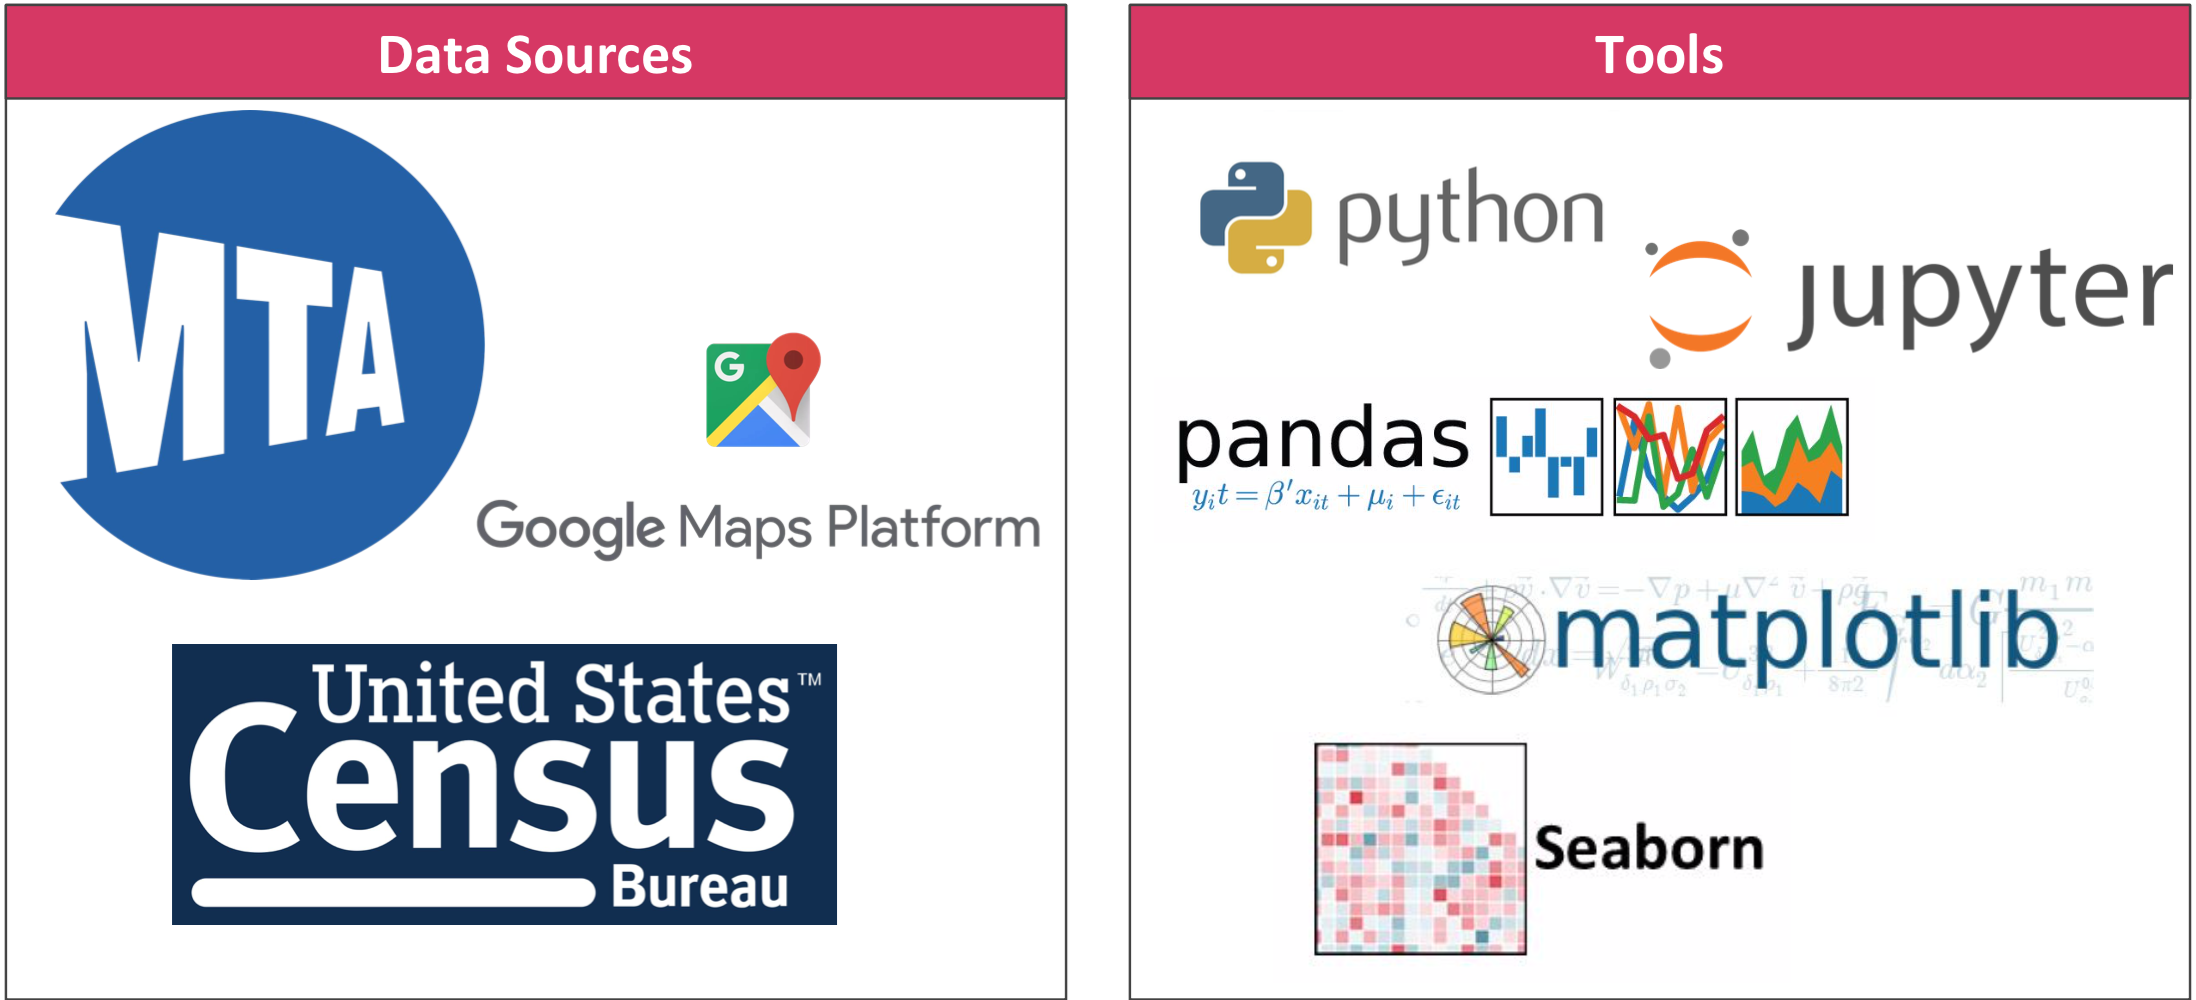
Data sources and tools used for this projectMost of our analysis was performed within Python using a software library called Pandas. Pandas is great for both data manipulation and analysis, with capabilities such as:
- Creating DataFrames, which essentially is a table with both columns and rows - very similar to Excel
- Ability to load data from flat files (e.g. CSV), Excel files, and databases
- ‘Group By’ functionality for both aggregating and transforming data
- Merging and joining data sets
- Easy handling of missing or null data (represented as NaN in Pandas)
An example Pandas use case is when my group wanted to merge MTA data with NYC census data. By default, the NYC census data came with zip codes, but MTA data did not. However, with the help of a technique known as geocoding, we were able to gather the zip codes of every train station. From there, we used Pandas to create a DataFrame that merged MTA data with NYC census data via zip codes. Voila!
-
Results: Once we built all the different DataFrames and calculated all values we wanted, it was time for us to visually display our findings. The tools we used for this project were Python libraries Matplotlib and Seaborn. Matplotlib provides the basic tools required to develop plots such as bar graphs and scatter charts. Seaborn is a Python library based on Matplotlib that allows for more aesthetically pleasing statistical graphs.
You can see an example of a graph we built for our group project below:
-
Future: Given the timeframe of this project, there were additional ideas my group had in terms of other factors to consider or visuals to develop, but unfortunately we were not able to include them in our final presentation. All those ideas went into this bucket of our general approach.
For our project specifically, knowing what we know now after our initial analysis, future considerations include:
- Looking into MTA turnstile exits activity
- Analyzing longitudinal MTA data (e.g. Sept 2017 vs. Sept 2018 MTA activity)
- Seeing if demographics correlates with MTA activity (e.g. gender)
- Identifying tech-centric locations and their proximity to MTA train stations
Final Thoughts
When it comes exploratory data analysis, the sky is the limit in terms of scope. There is so much data one can analyze and get insights from. It is important to remember that when starting off, it is OK to start with a narrower scope and expanding it afterwards. Perfectionism - that feeling of making sure you capture every data source you believe is relevant for your analysis - is not your friend here. Baby steps!
If interested, here’s the link to my group’s GitHub if you want to see what our final presentation looks like, as well as some of the code we developed to capture the results we ended up with.
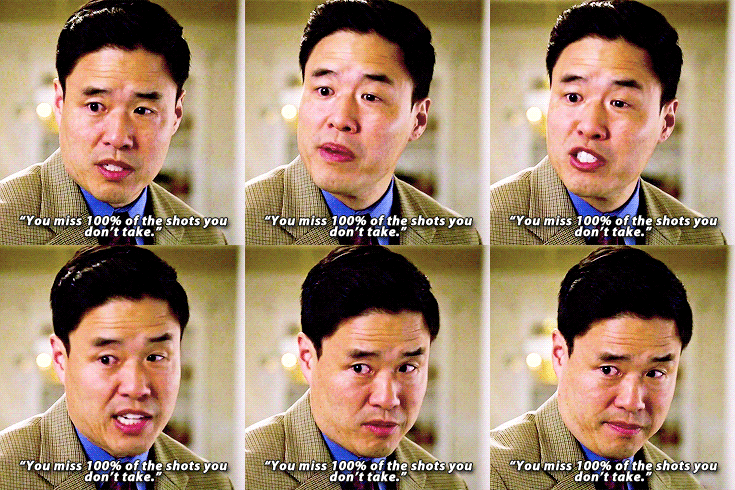
If you made it this far, thanks for reading! I guess I’ll leave an inspirational quote below to close this blog out:
STEVAY OUT!